Fertility Supplements Market Size to Grow by USD 819.22 million
Fertility Supplements Market Size to Grow by USD 819.22 million With 36% of the Contribution from North America – Technavio
The latest market research report titled Fertility Supplements Market by End-user and Geography – Forecast and Analysis 2022-2026 has been added to Technavio’s catalog. The report predicts the market to witness an accelerating growth momentum at a CAGR of 7.53%. Technavio categorizes the global fertility supplements market as a part of the global packaged food and meat market.
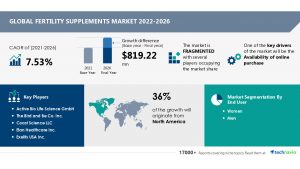
Our report provides extensive information on the value chain analysis for the fertility supplements market, which vendors can leverage to gain a competitive advantage during the forecast period. The data available in our value chain analysis segment can help vendors drive costs and enhance customer services during the forecast period. One of the key factors driving the global fertility supplements market growth is the availability of online purchases that allow vendors to minimize operational, setup, and distribution costs. In addition, Increasing cases of stress is one of the key fertility supplements market trends that is expected to impact the industry positively in the forecast period. However, one of the key challenges to the global fertility supplements market growth is the risk associated with fertility supplements.
For more insights on the scope, market dynamics, and value chain analysis, Read a FREE Sample Report
- End-user
-
- Women: The fertility supplements market share growth in the women segment will be significant during the forecast period. Infertility is a worldwide health issue that affects 20-30% of women of reproductive age in today’s culture. According to a datasheet released by the Population Reference Bureau (PRB) in August 2021, the fertility rate for women of all ages in high- and low-income countries has been declining since 1950. PCOS, endometriosis, premature ovarian failure, and pelvic inflammatory disease are just a few of the systemic and gynecological disorders that can impair the female reproductive system and lead to infertility. Such factors will contribute to the segment growth in the forecast years.
- Men
- Geography
-
- North America: 36% of the market’s growth will originate from North America during the forecast period. The US is the key market for fertility supplements in North America. Market growth in this region will be faster than the growth of the market in South America and MEA. The rising infertility rates and rising public awareness about overall health will facilitate the fertility supplements market growth in North America over the forecast period.
- Europe
- APAC
- South America
- Middle East And Africa
Download Sample Report for Segment-wise Insights and Regional Contributions
Fertility Supplements Market Scope
Technavio presents a detailed picture of the market by the way of study, synthesis, and summation of data from multiple sources. Our fertility supplements market report covers the following areas:
- Fertility Supplements Market size
- Fertility Supplements Market trends
- Fertility Supplements Market industry analysis
- The fertility supplements market is fragmented and the vendors are deploying growth strategies such as investment in R&D to compete in the market. This statistical study of the fertility supplements market encompasses successful business strategies deployed by the key vendors.
- The fertility supplements market forecast report offers in-depth insights into key vendor profiles. The profiles include information on the production, sustainability, and prospects of the leading companies. To make the most of the opportunities and recover from the pandemic impact, market vendors should focus more on the growth prospects in the fast-growing segments, while maintaining their positions in the slow-growing segments.
- Backed with competitive intelligence and benchmarking, our research reports on the Fertility Supplements Market are designed to provide entry support, customer profile, and M&As as well as go-to-market strategy support.
We provide a detailed analysis of around 25 vendors operating in the fertility supplements market, including some of the vendors:
- Active Bio Life Science GmbH
- The Bird and Be Co. Inc.
- Coast Science LLC
- Elan Healthcare Inc.
- Exeltis USA Inc.
- Fairhaven Health LLC
- Fertility Family
- Fertility Nutraceuticals LLC
- FUJIFILM Holdings Corp.
- Laboratorios Fertypharm SL
- LENUS Pharma GesmbH
- Natural Fertility Shop
- Nua Fertility Ireland Ltd.
- Nutra Business LLC
- Ocean Healthcare Pvt. Ltd.
- Orthomol pharmazeutische Vertriebs GmbH
- Pragati Biocare Pvt. Ltd.
- Shivani Scientific Industries Pvt. Ltd.
- TTK Healthcare Ltd.
- Wild Nutrition Ltd.
Want to know more about Vendor-specific Offerings and Strategic Initiatives, Read a Free Sample
- CAGR of the market during the forecast period 2022-2026
- Detailed information on factors that will assist fertility supplements market growth during the next five years
- Estimation of the fertility supplements market size and its contribution to the parent market
- Predictions on upcoming trends and changes in consumer behavior
- The growth of the fertility supplements market
- Analysis of the market’s competitive landscape and detailed information on vendors
- Comprehensive details of factors that will challenge the growth of fertility supplements market vendors
Related Reports:
Fertility Services Market by Service and Geography – Forecast and Analysis 2021-2025
Female Infertility Drugs Market by Route of Administration and Geography – Forecast and Analysis 2021-2025
Fertility Testing Devices Market by Product and Geography – Forecast and Analysis 2022-2026
|
Fertility Supplements Market Scope |
|
|
Report Coverage |
Details |
|
Page number |
120 |
|
Base year |
2021 |
|
Forecast period |
2022-2026 |
|
Growth momentum & CAGR |
Accelerate at a CAGR of 7.53% |
|
Market growth 2022-2026 |
$ 819.22 million |
|
Market structure |
Fragmented |
|
YoY growth (%) |
6.93 |
|
Regional analysis |
North America, Europe, APAC, South America, and Middle East and Africa |
|
Performing market contribution |
North America at 36% |
|
Key consumer countries |
US, China, Germany, UK, and France |
|
Competitive landscape |
Leading companies, competitive strategies, consumer engagement scope |
|
Companies profiled |
Active Bio Life Science GmbH, The Bird and Be Co. Inc., Coast Science LLC, Elan Healthcare Inc., Exeltis USA Inc., Fairhaven Health LLC, Fertility Family, Fertility Nutraceuticals LLC, FUJIFILM Holdings Corp., Laboratorios Fertypharm SL, LENUS Pharma GesmbH, Natural Fertility Shop, Nua Fertility Ireland Ltd., Nutra Business LLC, Ocean Healthcare Pvt. Ltd., Orthomol pharmazeutische Vertriebs GmbH, Pragati Biocare Pvt. Ltd., Shivani Scientific Industries Pvt. Ltd., TTK Healthcare Ltd., and Wild Nutrition Ltd. |
|
Market Dynamics |
Parent market analysis, Market growth inducers and obstacles, Fast-growing and slow-growing segment analysis, COVID-19 impact and future consumer dynamics, and market condition analysis for the forecast period. |
|
Customization purview |
If our report has not included the data that you are looking for, you can reach out to our analysts and get segments customized. |
1 Executive Summary
- 1.1 Market overview
-
- Exhibit 01: Executive Summary – Chart on Market Overview
- Exhibit 02: Executive Summary – Data Table on Market Overview
- Exhibit 03: Executive Summary – Chart on Global Market Characteristics
- Exhibit 04: Executive Summary – Chart on Market by Geography
- Exhibit 05: Executive Summary – Chart on Market Segmentation by End-user
- Exhibit 06: Executive Summary – Chart on Incremental Growth
- Exhibit 07: Executive Summary – Data Table on Incremental Growth
- Exhibit 08: Executive Summary – Chart on Vendor Market Positioning
2 Market Landscape
- 2.1 Market ecosystem
-
- Exhibit 09: Parent market
- Exhibit 10: Market Characteristics
3 Market Sizing
- 3.1 Market definition
-
- Exhibit 11: Offerings of vendors included in the market definition
- 3.2 Market segment analysis
-
- Exhibit 12: Market segments
- 3.3 Market size 2021
- 3.4 Market outlook: Forecast for 2021-2026
-
- Exhibit 13: Chart on Global – Market size and forecast 2021-2026 ($ million)
- Exhibit 14: Data Table on Global – Market size and forecast 2021-2026 ($ million)
- Exhibit 15: Chart on Global Market: Year-over-year growth 2021-2026 (%)
- Exhibit 16: Data Table on Global Market: Year-over-year growth 2021-2026 (%)
4 Five Forces Analysis
- 4.1 Five forces summary
-
- Exhibit 17: Five forces analysis – Comparison between 2021 and 2026
- 4.2 Bargaining power of buyers
-
- Exhibit 18: Chart on Bargaining power of buyers – Impact of key factors 2021 and 2026
- 4.3 Bargaining power of suppliers
-
- Exhibit 19: Bargaining power of suppliers – Impact of key factors in 2021 and 2026
- 4.4 Threat of new entrants
-
- Exhibit 20: Threat of new entrants – Impact of key factors in 2021 and 2026
- 4.5 Threat of substitutes
-
- Exhibit 21: Threat of substitutes – Impact of key factors in 2021 and 2026
- 4.6 Threat of rivalry
-
- Exhibit 22: Threat of rivalry – Impact of key factors in 2021 and 2026
- 4.7 Market condition
-
- Exhibit 23: Chart on Market condition – Five forces 2021 and 2026
5 Market Segmentation by End-user
- 5.1 Market segments
-
- Exhibit 24: Chart on End-user – Market share 2021-2026 (%)
- Exhibit 25: Data Table on End-user – Market share 2021-2026 (%)
- 5.2 Comparison by End-user
-
- Exhibit 26: Chart on Comparison by End-user
- Exhibit 27: Data Table on Comparison by End-user
- 5.3 Women – Market size and forecast 2021-2026
-
- Exhibit 28: Chart on Women – Market size and forecast 2021-2026 ($ million)
- Exhibit 29: Data Table on Women – Market size and forecast 2021-2026 ($ million)
- Exhibit 30: Chart on Women – Year-over-year growth 2021-2026 (%)
- Exhibit 31: Data Table on Women – Year-over-year growth 2021-2026 (%)
- 5.4 Men – Market size and forecast 2021-2026
-
- Exhibit 32: Chart on Men – Market size and forecast 2021-2026 ($ million)
- Exhibit 33: Data Table on Men – Market size and forecast 2021-2026 ($ million)
- Exhibit 34: Chart on Men – Year-over-year growth 2021-2026 (%)
- Exhibit 35: Data Table on Men – Year-over-year growth 2021-2026 (%)
- 5.5 Market opportunity by End-user
-
- Exhibit 36: Market opportunity by End-user ($ million)
6 Customer Landscape
- 6.1 Customer landscape overview
-
- Exhibit 37: Analysis of price sensitivity, lifecycle, customer purchase basket, adoption rates, and purchase criteria
7 Geographic Landscape
- 7.1 Geographic segmentation
-
- Exhibit 38: Chart on Market share by geography 2021-2026 (%)
- Exhibit 39: Data Table on Market share by geography 2021-2026 (%)
- 7.2 Geographic comparison
-
- Exhibit 40: Chart on Geographic comparison
- Exhibit 41: Data Table on Geographic comparison
- 7.3 North America – Market size and forecast 2021-2026
-
- Exhibit 42: Chart on North America – Market size and forecast 2021-2026 ($ million)
- Exhibit 43: Data Table on North America – Market size and forecast 2021-2026 ($ million)
- Exhibit 44: Chart on North America – Year-over-year growth 2021-2026 (%)
- Exhibit 45: Data Table on North America – Year-over-year growth 2021-2026 (%)
- 7.4 Europe – Market size and forecast 2021-2026
-
- Exhibit 46: Chart on Europe – Market size and forecast 2021-2026 ($ million)
- Exhibit 47: Data Table on Europe – Market size and forecast 2021-2026 ($ million)
- Exhibit 48: Chart on Europe – Year-over-year growth 2021-2026 (%)
- Exhibit 49: Data Table on Europe – Year-over-year growth 2021-2026 (%)
- 7.5 APAC – Market size and forecast 2021-2026
-
- Exhibit 50: Chart on APAC – Market size and forecast 2021-2026 ($ million)
- Exhibit 51: Data Table on APAC – Market size and forecast 2021-2026 ($ million)
- Exhibit 52: Chart on APAC – Year-over-year growth 2021-2026 (%)
- Exhibit 53: Data Table on APAC – Year-over-year growth 2021-2026 (%)
- 7.6 South America – Market size and forecast 2021-2026
-
- Exhibit 54: Chart on South America – Market size and forecast 2021-2026 ($ million)
- Exhibit 55: Data Table on South America – Market size and forecast 2021-2026 ($ million)
- Exhibit 56: Chart on South America – Year-over-year growth 2021-2026 (%)
- Exhibit 57: Data Table on South America – Year-over-year growth 2021-2026 (%)
- 7.7 Middle East and Africa – Market size and forecast 2021-2026
-
- Exhibit 58: Chart on Middle East and Africa – Market size and forecast 2021-2026 ($ million)
- Exhibit 59: Data Table on Middle East and Africa – Market size and forecast 2021-2026 ($ million)
- Exhibit 60: Chart on Middle East and Africa – Year-over-year growth 2021-2026 (%)
- Exhibit 61: Data Table on Middle East and Africa – Year-over-year growth 2021-2026 (%)
- 7.8 US – Market size and forecast 2021-2026
-
- Exhibit 62: Chart on US – Market size and forecast 2021-2026 ($ million)
- Exhibit 63: Data Table on US – Market size and forecast 2021-2026 ($ million)
- Exhibit 64: Chart on US – Year-over-year growth 2021-2026 (%)
- Exhibit 65: Data Table on US – Year-over-year growth 2021-2026 (%)
- 7.9 Germany – Market size and forecast 2021-2026
-
- Exhibit 66: Chart on Germany – Market size and forecast 2021-2026 ($ million)
- Exhibit 67: Data Table on Germany – Market size and forecast 2021-2026 ($ million)
- Exhibit 68: Chart on Germany – Year-over-year growth 2021-2026 (%)
- Exhibit 69: Data Table on Germany – Year-over-year growth 2021-2026 (%)
- 7.10 UK – Market size and forecast 2021-2026
-
- Exhibit 70: Chart on UK – Market size and forecast 2021-2026 ($ million)
- Exhibit 71: Data Table on UK – Market size and forecast 2021-2026 ($ million)
- Exhibit 72: Chart on UK – Year-over-year growth 2021-2026 (%)
- Exhibit 73: Data Table on UK – Year-over-year growth 2021-2026 (%)
- 7.11 China – Market size and forecast 2021-2026
-
- Exhibit 74: Chart on China – Market size and forecast 2021-2026 ($ million)
- Exhibit 75: Data Table on China – Market size and forecast 2021-2026 ($ million)
- Exhibit 76: Chart on China – Year-over-year growth 2021-2026 (%)
- Exhibit 77: Data Table on China – Year-over-year growth 2021-2026 (%)
- 7.12 France – Market size and forecast 2021-2026
-
- Exhibit 78: Chart on France – Market size and forecast 2021-2026 ($ million)
- Exhibit 79: Data Table on France – Market size and forecast 2021-2026 ($ million)
- Exhibit 80: Chart on France – Year-over-year growth 2021-2026 (%)
- Exhibit 81: Data Table on France – Year-over-year growth 2021-2026 (%)
- 7.13 Market opportunity by geography
-
- Exhibit 82: Market opportunity by geography ($ million)
8 Drivers, Challenges, and Trends
- 8.1 Market drivers
- 8.2 Market challenges
- 8.3 Impact of drivers and challenges
-
- Exhibit 83: Impact of drivers and challenges in 2021 and 2026
- 8.4 Market trends
9 Vendor Landscape
- 9.1 Overview
- 9.2 Vendor landscape
-
- Exhibit 84: Overview on Criticality of inputs and Factors of differentiation
- 9.3 Landscape disruption
-
- Exhibit 85: Overview on factors of disruption
- 9.4 Industry risks
-
- Exhibit 86: Impact of key risks on business
10 Vendor Analysis
- 10.1 Vendors covered
-
- Exhibit 87: Vendors covered
- 10.2 Market positioning of vendors
-
- Exhibit 88: Matrix on vendor position and classification
- 10.3 Active Bio Life Science GmbH
-
- Exhibit 89: Active Bio Life Science GmbH – Overview
- Exhibit 90: Active Bio Life Science GmbH – Product / Service
- Exhibit 91: Active Bio Life Science GmbH – Key offerings
- 10.4 Coast Science LLC
-
- Exhibit 92: Coast Science LLC – Overview
- Exhibit 93: Coast Science LLC – Product / Service
- Exhibit 94: Coast Science LLC – Key offerings
- 10.5 Exeltis USA Inc.
-
- Exhibit 95: Exeltis USA Inc. – Overview
- Exhibit 96: Exeltis USA Inc. – Product / Service
- Exhibit 97: Exeltis USA Inc. – Key offerings
- 10.6 Fairhaven Health LLC
-
- Exhibit 98: Fairhaven Health LLC – Overview
- Exhibit 99: Fairhaven Health LLC – Product / Service
- Exhibit 100: Fairhaven Health LLC – Key offerings
- 10.7 Fertility Nutraceuticals LLC
-
- Exhibit 101: Fertility Nutraceuticals LLC – Overview
- Exhibit 102: Fertility Nutraceuticals LLC – Product / Service
- Exhibit 103: Fertility Nutraceuticals LLC – Key offerings
- 10.8 FUJIFILM Holdings Corp.
-
- Exhibit 104: FUJIFILM Holdings Corp. – Overview
- Exhibit 105: FUJIFILM Holdings Corp. – Business segments
- Exhibit 106: FUJIFILM Holdings Corp. – Key news
- Exhibit 107: FUJIFILM Holdings Corp. – Key offerings
- Exhibit 108: FUJIFILM Holdings Corp. – Segment focus
- 10.9 LENUS Pharma GesmbH
-
- Exhibit 109: LENUS Pharma GesmbH – Overview
- Exhibit 110: LENUS Pharma GesmbH – Product / Service
- Exhibit 111: LENUS Pharma GesmbH – Key offerings
- 10.10 Orthomol pharmazeutische Vertriebs GmbH
-
- Exhibit 112: Orthomol pharmazeutische Vertriebs GmbH – Overview
- Exhibit 113: Orthomol pharmazeutische Vertriebs GmbH – Product / Service
- Exhibit 114: Orthomol pharmazeutische Vertriebs GmbH – Key offerings
- 10.11 Pragati Biocare Pvt. Ltd.
-
- Exhibit 115: Pragati Biocare Pvt. Ltd. – Overview
- Exhibit 116: Pragati Biocare Pvt. Ltd. – Product / Service
- Exhibit 117: Pragati Biocare Pvt. Ltd. – Key offerings
- 10.12 TTK Healthcare Ltd.
-
- Exhibit 118: TTK Healthcare Ltd. – Overview
- Exhibit 119: TTK Healthcare Ltd. – Business segments
- Exhibit 120: TTK Healthcare Ltd. – Key offerings
- Exhibit 121: TTK Healthcare Ltd. – Segment focus
11 Appendix
- 11.1 Scope of the report
- 11.2 Inclusions and exclusions checklist
-
- Exhibit 122: Inclusions checklist
- Exhibit 123: Exclusions checklist
- 11.3 Currency conversion rates for US$
-
- Exhibit 124: Currency conversion rates for US$
- 11.4 Research methodology
-
- Exhibit 125: Research methodology
- Exhibit 126: Validation techniques employed for market sizing
- Exhibit 127: Information sources
- 11.5 List of abbreviations
-
- Exhibit 128: List of abbreviations